Application Monitoring with Micrometer, Prometheus, Grafana, and CloudWatch
Posted May 13, 2021 ‐ 15 min read
The Importance of Observability
One of the most important aspects of an application is observability. It is difficult to know whether an application is working as expected without monitoring data. Collecting and analyzing metrics helps us understand whether an application is healthy as well as how it behaves under load. Metrics also help in deriving a performance baseline which could be used to define alerts, scaling rules, or to understand the performance effects of a recent change.
Monitoring is particularly useful when things go wrong. If service availability is affected we want to be notified automatically so that we could respond to operational issues quickly. It might also be desired to be notified when the application changes state, such as during a scaling event. When a failure does occur, we often need to review historical monitoring data to help find out the root cause.
Before going to production, it is important to stress-test an application to find and fix potential issues. Metrics could help in analysing whether application code and configuration need to be updated.
Other aspects of monitoring such as log collection and distributed tracing are also very important but are not the focus of this article.
Monitoring Stack
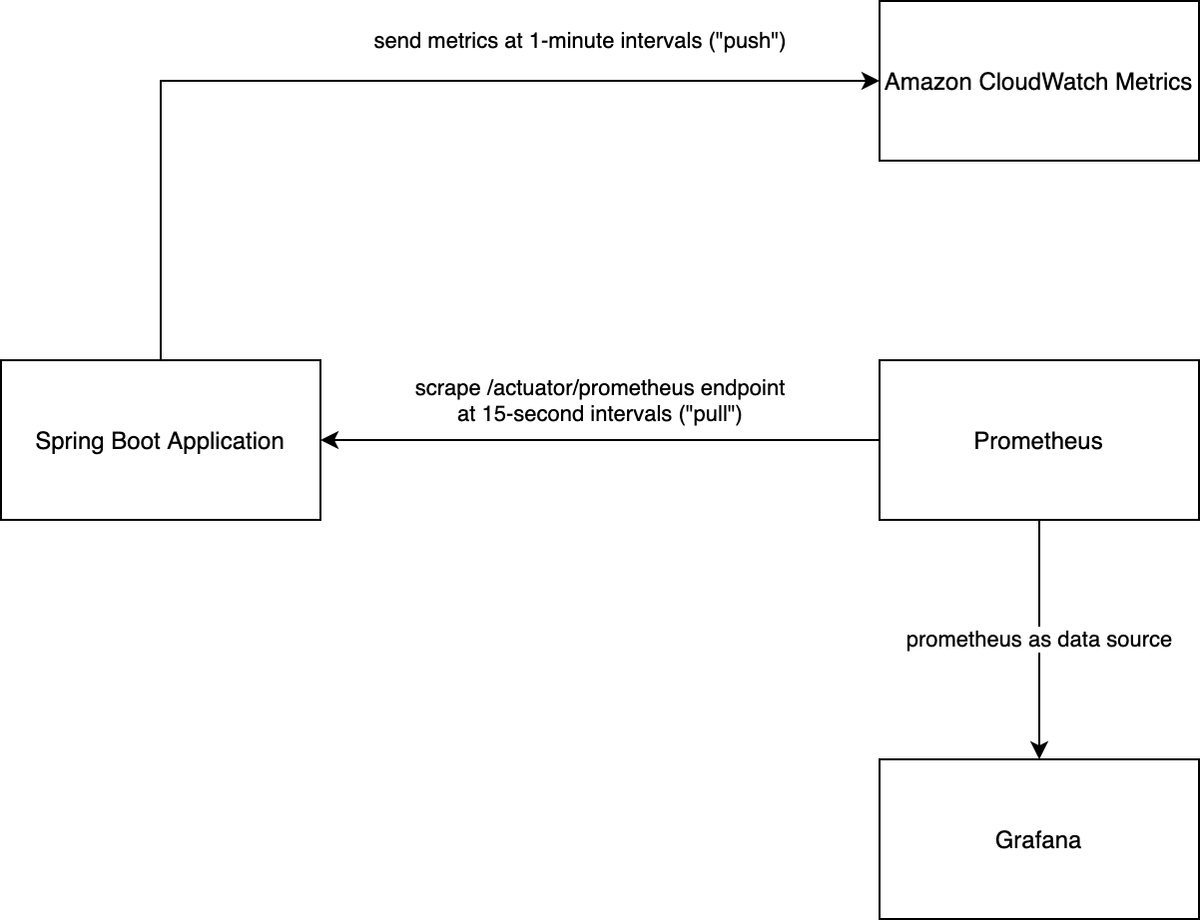
To demonstrate the concepts we'll build a local monitoring stack using Docker Compose as shown in the following diagram. We'll focus mainly on Prometheus but will also show how to send metrics to CloudWatch Metrics in order to present a more heterogeneous example. Project code to accompany this article is available on GitHub.
Instrumented Spring Boot Application
We start with the Spring Boot application. In order to instrument it we include the Micrometer library. We do this by adding the Spring Boot Actuator module which uses Micrometer at its core to collect metrics that are important to monitor JVM applications. In addition to adding metrics, the actuator dependency also adds useful management features to the application, such as health-check, heap-dump and thread-dump endpoints. With Spring Boot it is common to add the actuator dependency rather than micrometer directly.
The Micrometer library implements various Meter types each collecting one or more metrics. This is how Micrometer differentiates meters and metrics. For example, a Counter meter maintains a single metric, namely a count. A Timer meter, however, will not only measure the total amount of time recorded for a particular event, but also count the number of events overall. As we'll see a Timer could also be configured to send additional metrics such as percentiles and histograms.
Meters are managed by a MeterRegistry which provides the monitoring system specific implementation. Meter registries exist for many monitoring systems including DataDog, Prometheus, and CloudWatch. A CompositeMeterRegistry implementation can combine multiple registries in the same application. A convenience static class called globalRegistry is a composite registry which we will use to add both Prometheus and CloudWatch MeterRegistry implementations.
The Spring Boot Actuator module also adds a handy endpoint called metrics which allows us to list the active meter names as well as drill into a particular meter. Before querying the metrics endpoint let's update the configuration management section as shown below:
management:
  server:
    port: 8081
  endpoints:
    web:
      exposure:
        include: health, info, metrics, prometheus
The actuator module exposes, by default, the /actuator base endpoint listening on the same port as the application server. The configuration above ensures that the management server listens on a different port. This is considered best practice as it avoids sharing the main server thread pool to serve both application requests and management requests. Note that we have also added the metrics and prometheus endpoints in addition to the default health and info endpoints. We'll get to Prometheus shortly, but for now let's see how we can query the actuator's metrics endpoint.
Let's start by running the demo application:
$ cd app
$ ./gradlew bootRun
In a separate terminal, query the metrics actuator endpoint using cURL:
$ curl -s http://localhost:8081/actuator/metrics | jq
With the (truncated) output:
{
  "names": [
    "jvm.buffer.count",
    "jvm.buffer.memory.used",
    "jvm.buffer.total.capacity",
    "jvm.threads.states",
    "tomcat.sessions.active.current",
    "tomcat.sessions.expired",
    "tomcat.sessions.rejected"
  ]
}
Note that the metrics endpoint actually returns a list of all meter names collected from the default meter registry.
Let's drill down to an individual meter, such as jvm.threads.states in the following example:
$ curl -s http://localhost:8081/actuator/metrics/jvm.threads.states | jq
With the output:
{
  "name": "jvm.threads.states",
  "description": "The current number of threads having BLOCKED state",
  "baseUnit": "threads",
  "measurements": [
    {
      "statistic": "VALUE",
      "value": 39
    }
  ],
  "availableTags": [
    {
      "tag": "state",
      "values": [
        "timed-waiting",
        "new",
        "runnable",
        "blocked",
        "waiting",
        "terminated"
      ]
    }
  ]
}
The jvm.threads.states meter is of type Gauge. This meter type only records a value when the metric needs to be published. The implementation for this particular meter queries the ThreadMXBean management interface to retrieve the number of running threads in a particular state.
Micrometer supports the important concept of meter dimensionality. This means that in addition to a name used to identify the meter, key-value pairs (known as tags in Micrometer) could be added to specify particular dimensions. To continue with the jvm.threads.states meter example, let's also specify the value runnable for the state tag when querying the meter:
$ curl -s http://localhost:8081/actuator/metrics/jvm.threads.states?tag=state:runnable | jq
With the output:
{
  "name": "jvm.threads.states",
  "description": "The current number of threads having RUNNABLE state",
  "baseUnit": "threads",
  "measurements": [
    {
      "statistic": "VALUE",
      "value": 12
    }
  ],
  "availableTags": []
}
As we can see, the result returns the number of runnable threads compared to the total number of threads in the previous, aggregated, view. Dimensional metrics are very flexible as they allow us to have a high-level overview of the data as well as slice and dice the data to facilitate analysis.
Prometheus
To take advantage of dimensional metrics we need to use a monitoring system that supports storing and analyzing such metrics. Luckily, systems such as Prometheus and CloudWatch Metrics support the concept of metric dimensionality. These systems store the published metrics in what's known as a time-series database. Prometheus uses a separate time-series for each combination of dimensions. This is why it's important to ensure that dimensions have low cardinality, meaning that the set of values for a particular dimension is bounded.
Prometheus takes a different approach than most monitoring systems, namely metrics are pulled by Prometheus rather than pushed by the application. To support this model the application has to expose an endpoint where metric data can be scraped by the monitoring system. The prometheus endpoint available through the actuator module provides the metric data in a format that is supported by Prometheus. Let's have a look at a snippet of the data as exported by the scrape endpoint:
$ curl -s http://localhost:8081/actuator/prometheus
...
# HELP jvm_threads_states_threads The current number of threads having NEW state
# TYPE jvm_threads_states_threads gauge
jvm_threads_states_threads{state="runnable",} 11.0
jvm_threads_states_threads{state="blocked",} 0.0
jvm_threads_states_threads{state="waiting",} 22.0
jvm_threads_states_threads{state="timed-waiting",} 6.0
jvm_threads_states_threads{state="new",} 0.0
jvm_threads_states_threads{state="terminated",} 0.0
...
There are a few things to note about the export above. Although the original meter is named jvm.threads.states, the Prometheus naming convention is applied: names are converted to snake-case, and the base unit ("threads" in this example) is appended to the metric name. The various combinations of dimensions are expanded so that Prometheus can maintain a separate time-series for each combination. Prometheus uses the term label to name a dimension key such as state. This is equivalent to a tag in Micrometer.
With the scrape endpoint in place, let's spin up a Prometheus service and configure it to scrape the application endpoint. To do that let's spin up the Docker Compose stack in our project:
$ docker-compose up
In this stack the app service is our Spring Boot application. The prometheus service uses the official Prometheus Docker image (prom/prometheus) with the following configuration to scrape the app service:
global:
  scrape_interval: 15s

scrape_configs:
  - job_name: "Spring Boot Application"
    metrics_path: /actuator/prometheus
    static_configs:
      - targets:
          - "app:8081"
The configuration is straightforward: we set the scrape interval as well as the application as a target to scrape. Once both services have come up, we could query metrics over time in the Expression Browser available at http://localhost:9090/graph.
Timers, Histograms and Percentiles
With the application and Prometheus services running in our Docker Compose stack, let's have a look at another metric that comes built-in with the Actuator module: http.server.requests. This metric is a Timer meter which is used to measure HTTP server request duration. As a side note, this metric is applicable whether you're using Web MVC, WebFlux, or Jersey in your Spring application.
The http.server.requests metric won't show up in the metrics or prometheus endpoints without any intercepted requests. To be able to test this we've added a simple Controller implementation that simulates work by sleeping for a 100 milliseconds:
@Controller
public class DemoController {
    @GetMapping("/demo")
    @ResponseBody
    public void doSomeWork() throws InterruptedException {
        Thread.sleep(100);
    }
}
Let's use the hey HTTP load generator utility to send 100,000 HTTP GET requests to our /demo endpoint:
$ hey -n 100000 -m GET http://localhost:8080/demo
As previously mentioned, the Timer meter not only measures the total event duration, but also the total count of events. With the hey client running for a couple of minutes, let's use the query language of Prometheus, PromQL, to analyze the data.
By entering the value http_server_requests_seconds_count in the Expression Browser's table view, we should get the current value of 100,000 total requests. The counter is more useful in deriving the number of requests per second using the rate function. The following graph shows the rate of requests per second, averaged over 1-minute intervals: rate(http_server_requests_seconds_count[1m]).
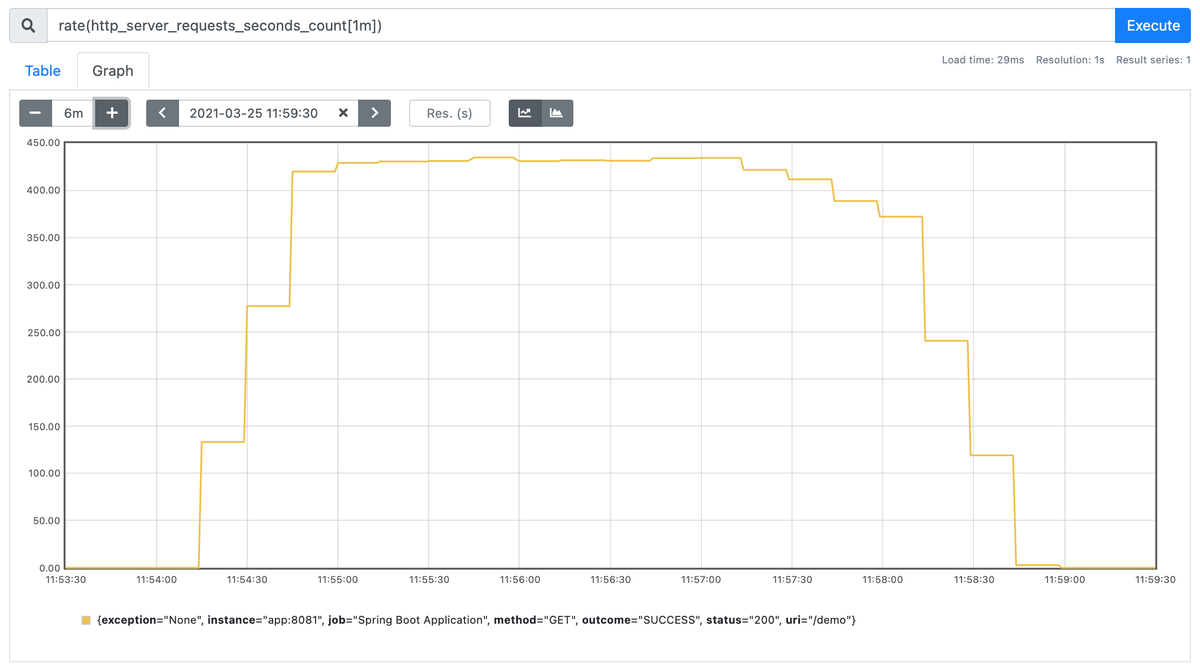
The graph shows that we've maintained a rate of approximately 430 requests per second. A single Tomcat thread should be able to handle up to 10 requests per second given the 100ms sleep time (although in practice this is a lower number due to the additional overhead). In addition, the hey load generator defaults to 50 concurrent workers. This means that our upper bound is set to 500 requests per second.
Next, let's graph the average duration time of server request processing. To do that, we'll use the duration counter and divide its rate by the rate of events: rate(http_server_requests_seconds_sum[1m]) / rate(http_server_requests_seconds_count[1m]).
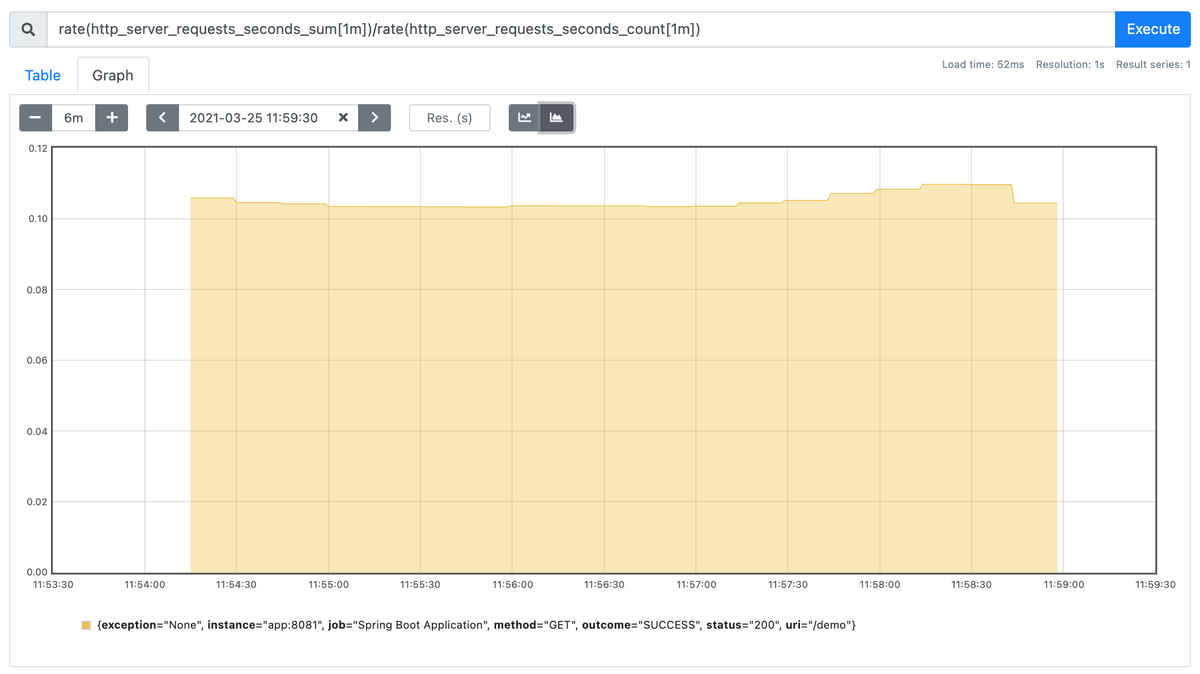
As expected, the graph shows that the average request duration is somewhere in the range of 100ms to 120ms. The request rate as well as the average request duration can serve as good performance baseline metrics as they give us an indication of what a single instance of our application can handle under load.
An average request duration, however, does not tell the entire story. In order to better understand how our system behaves, we need to know what the outliers are. For example, it is useful to know what the duration value of the 95th percentile is as it indicates that 5% of all requests take longer to process.
Some monitoring systems, like Prometheus, can calculate percentiles (or more generally quantiles) by using histograms exported by Micrometer. The histogram is a collection of buckets (or counters), each maintaining the number of events observed that took up to duration specified by the le tag. Let's have a look at a part of the histogram as published by our demo application:
http_server_requests_seconds_bucket{exception="None",method="GET",outcome="SUCCESS",status="200",uri="/demo",le="0.067108864",} 0.0
http_server_requests_seconds_bucket{exception="None",method="GET",outcome="SUCCESS",status="200",uri="/demo",le="0.089478485",} 0.0
http_server_requests_seconds_bucket{exception="None",method="GET",outcome="SUCCESS",status="200",uri="/demo",le="0.111848106",} 92382.0
http_server_requests_seconds_bucket{exception="None",method="GET",outcome="SUCCESS",status="200",uri="/demo",le="0.134217727",} 99050.0
http_server_requests_seconds_bucket{exception="None",method="GET",outcome="SUCCESS",status="200",uri="/demo",le="0.156587348",} 99703.0
...
...
http_server_requests_seconds_bucket{exception="None",method="GET",outcome="SUCCESS",status="200",uri="/demo",le="0.984263336",} 99987.0
http_server_requests_seconds_bucket{exception="None",method="GET",outcome="SUCCESS",status="200",uri="/demo",le="1.0",} 99987.0
http_server_requests_seconds_bucket{exception="None",method="GET",outcome="SUCCESS",status="200",uri="/demo",le="+Inf",} 100000.0
The second line in the listing above indicates there were no requests observed that took up to ~89ms (specified by the le tag). This is expected given the 100ms sleep time when processing requests. Line #3 shows that 92,382 requests were observed whose duration took up to ~111ms. Note that the histogram is cumulative and that the entire count of requests falls in the last bucket with no upper limit le="+Inf".
Maintaining a histogram is computationally cheaper on the client-side as it pushes the responsibility to the monitoring system. In addition, it is also possible to add new percentile calculations without having to change client-side code.
Let's use the histogram_quantile() function to calculate the 99th percentile of the http server request duration: histogram_quantile(0.99, rate(http_server_requests_seconds_bucket[1m])).
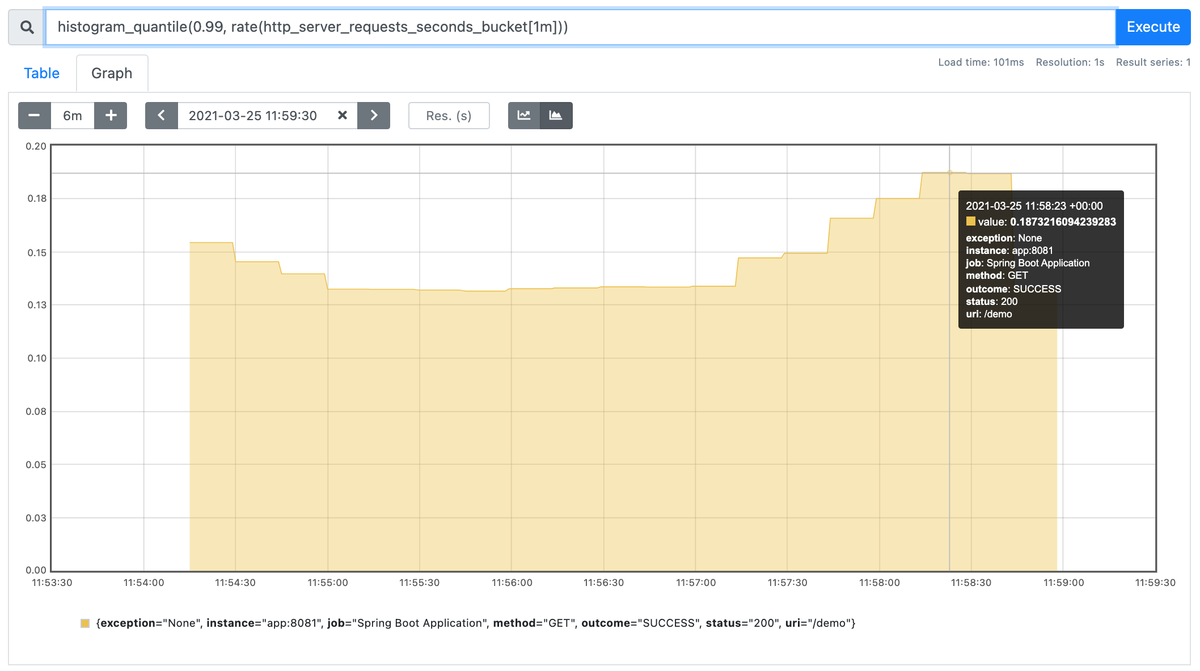
The graph shows that at around 11:58:30 one percent of requests were slower than ~187ms.
Note that histograms are not enabled by default for timers. To enable maintaining and publishing histograms, we can update the application configuration with the metric prefix as shown in the following snippet of the configuration:
management:
  metrics:
    distribution:
      percentiles-histogram:
        http.server.requests: true
      maximum-expected-value:
        http.server.requests: 1s
In the configuration above we also update the maximum expected value to 1 second from the default of 30 seconds. This can improve the accuracy of the histogram, as well as reduce the number of buckets required to be published.
CloudWatch Metrics
It is not uncommon to use more than one monitoring system. For example, let's assume our workload is running in AWS. In this setup we use CloudWatch Metrics and Alarms. However, we might also want to use higher resolution metrics for some of our application metrics and prefer to maintain a Prometheus service for this purpose. As previously mentioned, Micrometer implements a CompositeMeterRegistry class that allows using more than one registry in an application.
In the demo project we've added the micrometer-registry-cloudwatch2 dependency. Note that the number suffix indicates the registry implementation uses version 2 of the AWS SDK. The CloudWatchMeterRegistry is a PushMeterRegistry which actively publishes metrics to CloudWatch using the PutMetric API.
The default configuration for the CloudWatch registry sends metrics at a 1-minute interval. In our project, the registry is disabled by default, but could be enabled by enabling the following configuration flag: management.metrics.export.cloudwatch.enabled. Please keep in mind that there could be cost associated with using the CloudWatch API.
It might also be desired to reduce the number of metrics sent to a particular registry, or all registries. This could be achieved with Micrometer's MeterFilter. A MeterFilter could, for example, deny certain filters from being added to a registry based on a given predicate. It is also possible to modify Meter configurations using a MeterFilter. Let's look at an excerpt of our CloudWatch registry configuration.
@Bean
@ConditionalOnMissingBean
public CloudWatchMeterRegistry cloudWatchMeterRegistry(CloudWatchConfig cloudWatchConfig, Clock clock, CloudWatchAsyncClient cloudWatchAsyncClient) {
    CloudWatchMeterRegistry cloudWatchMeterRegistry = new CloudWatchMeterRegistry(cloudWatchConfig, clock, cloudWatchAsyncClient);
    cloudWatchMeterRegistry.config()
            .meterFilter(MeterFilter.denyUnless(id -> id.getName().startsWith("http")))
            .meterFilter(percentiles("http", 0.90, 0.95, 0.99));
    return cloudWatchMeterRegistry;
}

static MeterFilter percentiles(String prefix, double... percentiles) {
    return new MeterFilter() {
        @Override
        public DistributionStatisticConfig configure(Meter.Id id, DistributionStatisticConfig config) {
            if (id.getType() == Meter.Type.TIMER && id.getName().startsWith(prefix)) {
                return DistributionStatisticConfig.builder()
                        .percentiles(percentiles)
                        .build()
                        .merge(config);
            }
            return config;
        }
    };
}
In the code above, we add two filters to the registry. The first allows only meters starting with http to be added to the registry. The second filter adds percentile configuration to Timer meters starting with http. This enables client-side calculation of the 90th, 95th, and 99th percentiles which are then published to CloudWatch.
Grafana
Many monitoring systems offer their own integrated solutions for graphing metrics. Grafana allows us to pull metrics from different data sources including Prometheus.
In our demo stack we've included Grafana and used its provisioning feature to set up Prometheus as a data source as well as provision a minimal service dashboard. The dashboard displays the average HTTP server request duration as well as a few chosen percentiles:
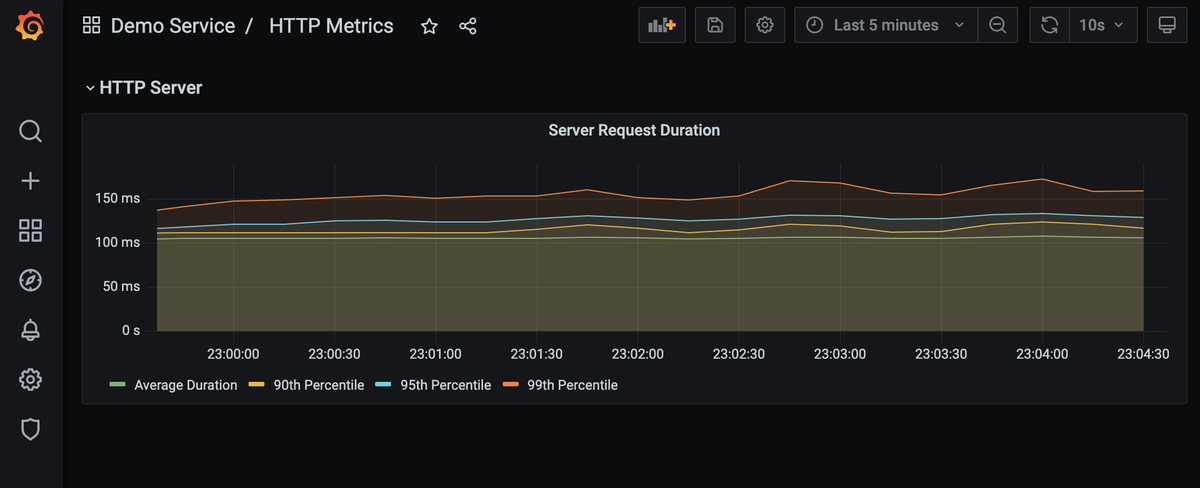
We follow a similar approach as we have done with the Prometheus service: we use bind-mounts for the provisioning and dashboards directories. To provision the Prometheus data source we use the following configuration in /etc/grafana/provisioning/datasources/:
apiVersion: 1

datasources:
  - name: Prometheus
    type: prometheus
    access: proxy
    url: http://prometheus:9090
To provision the dashboard we define a data provider with the following configuration in /etc/grafana/provisioning/dashboards/:
apiVersion: 1

providers:
  - name: Default
    folder: Demo Service
    type: file
    options:
      path: /dashboards/
The dashboard itself is then picked up from /dashboards as specified by the configuration above. The JSON model used has been exported from Grafana.
Summary
In order to experiment with Metrics it is useful to have more than just a demo instrumented application. In this post we've started by instrumenting a Spring Boot application, but then added Prometheus and Grafana services to our Docker Compose stack, in order to store, analyze and graph the collected metrics. We've also shown how the CloudWatch registry could be added and configured to send selective metrics to AWS CloudWatch Metrics.