ECS Service Auto-Scaling with the CDK
Posted May 14, 2021 ‐ 14 min read
In a previous article we've seen how to use the CDK to provision and deploy a containerized service on ECS. However, we've only deployed a static number of tasks to handle service load. Using the CDK we can easily provision a service to dynamically scale based on metrics and schedules. Before we review the required code changes, let's have a closer look at how service auto-scaling works.
Application Auto Scaling Service
At the core of Service Auto Scaling is the more general Application Auto Scaling service. This is an AWS service that manages scaling of other services such as DynamoDB, RDS, and ECS. Each of these managed services consists of scalable resources. DynamoDB, for example, can scale its tables and indexes, while ECS can scale its running services.
In order to scale a resource we need to specify a dimension by which to scale. For a DynamoDB table, this would be the read or write capacity units. For an ECS service, the scalable dimension would be the desired number of tasks.
To specify the target resource and dimension we need to register a Scalable Target with the Application Auto Scaling service. The scalable target for ECS is then the service resource with the desired task count as the scalable dimension.
Once we’ve registered a scalable target, there are three different ways to scale it: target tracking scaling, step scaling, and scheduled scaling. In this article we'll omit step scaling and focus on the other two methods.
Target Tracking Scaling
Target tracking scaling is a reactive approach that monitors a particular metric in CloudWatch and compares its current value with a given target value.
For example, if we were to choose 50% as the target value of the service CPU utilization metric, then the Application Auto Scaling service will update the capacity of the ECS service in order to reach the target value, or at least a value close to it. Specifically, if the current service CPU utilization value is above 50%, more capacity will be added as the overall load on our service is above the threshold value we’ve set. This is known as a scale-out event. Conversely, if the current value is below 50%, capacity will be removed. This is known as a scale-in event.
This behavior is achieved by creating a target tracking scaling policy with the Application Auto Scaling service, which then creates and manages the corresponding CloudWatch alarms to be notified when capacity needs to be updated.
Note that the service capacity is still bound to the configured range of minimum to maximum service capacity. It’s the desired count that gets updated by this policy. That means, for example, that for a service defined with a maximum of 5 tasks, the desired count cannot go above this limit, even when the policy calls for a scale-out event.
A cool-down period is defined for both scale-out and scale-in events. This is the time period the scheduler waits before potentially triggering any new scaling activities. This is to avoid excessive scale-out but at the same time ensure application availability by not scaling in too quickly. The cool-down periods could also be adjusted.
It’s important to note that in addition to using predefined metrics such as our service CPU utilization example, a custom application metric could also be used.
Scheduled Scaling
Scheduled scaling is a proactive approach that allows us to update service capacity at predefined times. This is useful in adjusting service capacity limits based on a predictable load pattern.
To trigger a scaling activity at a particular time we need to create a Scheduled Action with the Application Auto Scaling service. Unlike target tracking scaling, this scaling activity updates the minimum and maximum capacity values of the targeted ECS service.
When a scheduled event is triggered, the new minimum capacity value, if specified by the scaling configuration, is updated. In addition, the new value is compared against the current capacity. A scale-out event would follow if the current capacity is lower than the new minimum capacity. Conversely, if a new maximum capacity value is specified, a scale-in event would occur if the new maximum capacity value is lower than the current capacity.
This scaling method could also be used to complement other methods such as target tracking scaling. For example, scheduled scaling could ensure that the service capacity does not drop below a certain threshold during a particular time window, while target tracking scaling would continue to adjust the desired task count reactively based on a chosen target metric.
Service Auto Scaling Flow
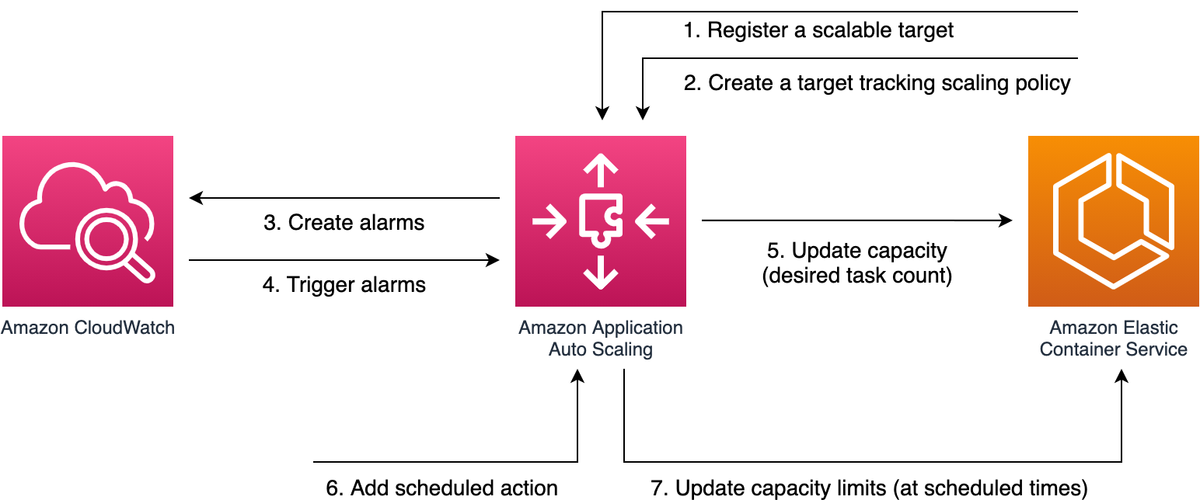
Let’s summarize how the various services interact in order to achieve ECS service auto-scaling.

At the center of the diagram above is the Application Auto Scaling service. First, we register our ECS service as a scalable target. Once we’ve registered our service, we could choose to create a target tracking scaling policy. For example, one that tracks the service CPU utilization.
This causes the Application Auto Scaling service to create and manage CloudWatch alarms which are configured to track the metric based on the target value specified. At this point it’s up to the Application Auto Scaling service to respond to alarm breaches and potentially change the capacity of the ECS service.
In addition to this flow, we could also add scheduled actions which could update the minimum and maximum capacity of our service, potentially triggering additional scaling events.
Next, let’s see how to implement this with the CDK.
CDK Code Example
The code for the article is available on GitHub. I assume you already have CDK installed, but if you don't then have a look at my other article which covers CDK in more detail. The CDK stack is written in TypeScript and the service itself is a minimal Python service using the FastAPI framework.
To provision and deploy our demo ECS cluster and service, issue a cdk deploy command in the root directory of the project. Note that some resources used in this example will incur cost, so make sure you have a billing alarm set up. In addition, it's a good idea to tear down the stack using cdk destroy as soon as you're done testing.
The CDK stack defined in the EcsServiceAutoScalingStack class creates a VPC across two availability-zones with isolated subnets in which service tasks could run. VPC endpoints are used to pull images from the Elastic Container Registry (ECR) as well as publish logs to CloudWatch Logs. By using ECR and its required VPC endpoints we can avoid provisioning NAT gateways. Finally, the stack creates an ECS cluster using the provisioned VPC.
const vpc = new ec2.Vpc(this, 'EcsAutoScalingVpc', {
    maxAzs: 2,
    natGateways: 0
});

vpc.addGatewayEndpoint('S3GatewayVpcEndpoint', {
    service: ec2.GatewayVpcEndpointAwsService.S3
});
vpc.addInterfaceEndpoint('EcrDockerVpcEndpoint', {
    service: ec2.InterfaceVpcEndpointAwsService.ECR_DOCKER
});
vpc.addInterfaceEndpoint('EcrVpcEndpoint', {
    service: ec2.InterfaceVpcEndpointAwsService.ECR
});
vpc.addInterfaceEndpoint('CloudWatchLogsVpcEndpoint', {
    service: ec2.InterfaceVpcEndpointAwsService.CLOUDWATCH_LOGS
});

const cluster = new ecs.Cluster(this, 'EcsClusterAutoScalingDemo', {
    vpc: vpc
});
Creating a VPC for a single service might not be what you want to do in production, however, it allows this example to be self-contained.
Next, we use the CDK's ECS patterns library to provision our Python service with the ApplicationLoadBalancedFargateService pattern and a desired task count of 1. The container image is provided by calling the ContainerImage.fromAsset method which builds the image from the Dockerfile in the service directory. The image is associated with the the app container definition of our service task definition. The image is uploaded to ECR as part of the deployment process.
const taskDefinition = new ecs.FargateTaskDefinition(this, 'AutoScalingServiceTask', {
    family: 'AutoScalingServiceTask'
});

const image = ecs.ContainerImage.fromAsset('service');

const containerDefinition = taskDefinition.addContainer('app', {
    image: image,
    portMappings: [{ containerPort: 8080 }]
});

const albService = new ecsPatterns.ApplicationLoadBalancedFargateService(
    this, 'AutoScalingService', {
    cluster: cluster,
    desiredCount: 1,
    taskDefinition: taskDefinition
});
Once we've deployed our stack with the cdk deploy command, we should get the service URL as one of the stack outputs. This service URL points to the load balancer fronting our service which, so far, consists of a single running task.
Let’s use hey to generate load on our service:
$ hey -n 100000 -c 300 <service URL>
The above command sends 100,000 requests to the service endpoint using 300 concurrent workers. Running this on my machine and testing the remote endpoint results in an average request rate of about 400 requests per second.
Simple Service Dashboard
Our CDK stack also includes a CloudWatch dashboard consisting of the metrics we'd like to observe including the service average CPU utilization and the load balancer request rate. Here's a snippet of the dashboard code adding the CPU utilization metric as a GraphWidget. Note that we override the default period value of 5 minutes as the service metrics are sent at a 1-minute interval and we want to take advantage of this granularity.
const dashboard = new cloudwatch.Dashboard(this, 'Dashboard', {
    dashboardName: 'AutoScalingExample'
});

const cpuUtilizationMetric = albService.service.metricCpuUtilization({
    period: Duration.minutes(1),
    label: 'CPU Utilization'

dashboard.addWidgets(
    new cloudwatch.GraphWidget({
        left: [cpuUtilizationMetric],
        width: 12,
        title: 'CPU Utilization'
    })
);
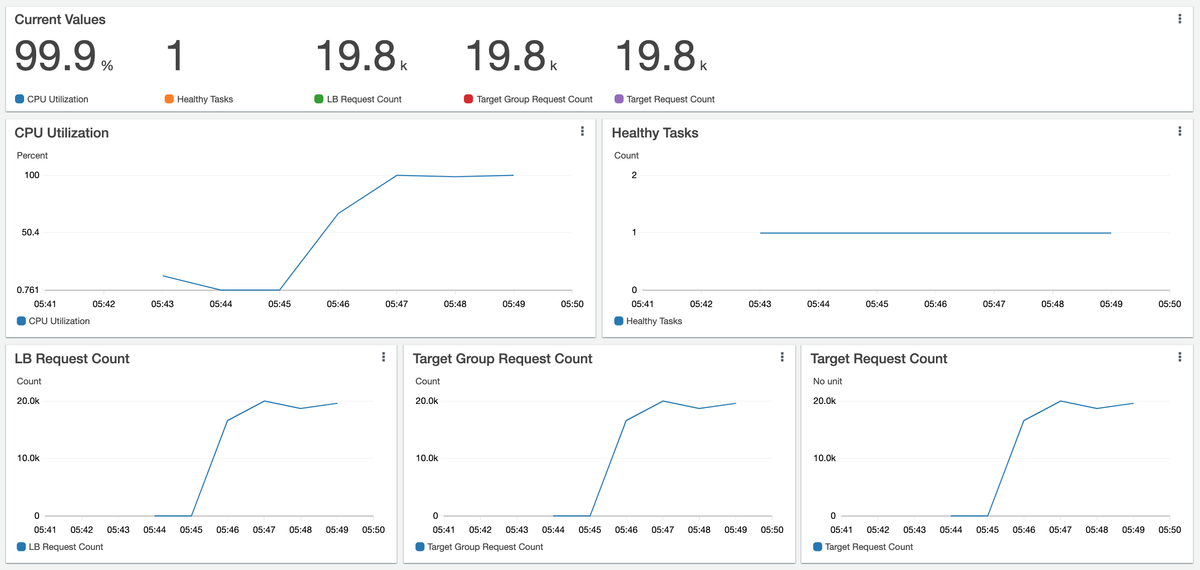
Let's look at our service dashboard during the load test:

We've added a few SingleValueWidgets to display current metric values. We can see that the utilization of the single running task has reached maximum capacity with a request rate of almost 20K per minute. Our service is registered as the target group of the load balancer and at this point the target group consists of the single task. This is why the request rates at the bottom of the dashboard are all identical.
At this point we've measured the performance of a single task. Assuming we've done all we could to optimize the service implementation itself, the next step is to configure our ECS service to auto-scale.
Target Tracking Scaling Example
Let's have a look at the changes in the scale-by-cpu branch in our example project. In the following code albService is an instance of our provisioned ApplicationLoadBalancedFargateService:
const scalableTaskCount = albService.service.autoScaleTaskCount({
    maxCapacity: 4
});

scalableTaskCount.scaleOnCpuUtilization('CpuUtilizationScaling', {
    targetUtilizationPercent: 50
});
The autoScaleTaskCount call translates to a scalable target registration with the Application Auto Scaling service. In addition to specificying the ECS service as the scalable target and its limits, a service-linked role is used which allows Application Auto Scaling to manage alarms with CloudWatch as well as update ECS service capacity on our behalf.
The scaleOnCpuUtilization call translates to a target tracking scaling policy registration associated with the scaling target returned by the autoScaleTaskCount call.
Let's update our service stack by issuing another cdk deploy command.
Creating a new target tracking policy triggers the creation of two alarms with CloudWatch. Both alarms monitor the average CPU utilization of the target service. The alarm associated with triggering a scale-out event evaluates the metric for 3 minutes. If the average metric value is greater than 50% for all three samples, a scale-out event would occur. The alarm associated with scaling-in is more conservative and evaluates the average CPU for a period of 15 minutes before triggering a scale-in event. This is to ensure availability by not scaling in too quickly. The threshold value for the scale-in alarm is at 45%, likely to avoid too much flactuation in service capacity.
With the updated auto-scaling configuration, let's run another load test with an overall larger number of requests:
$ hey -n 2000000 -c 300 <service URL>
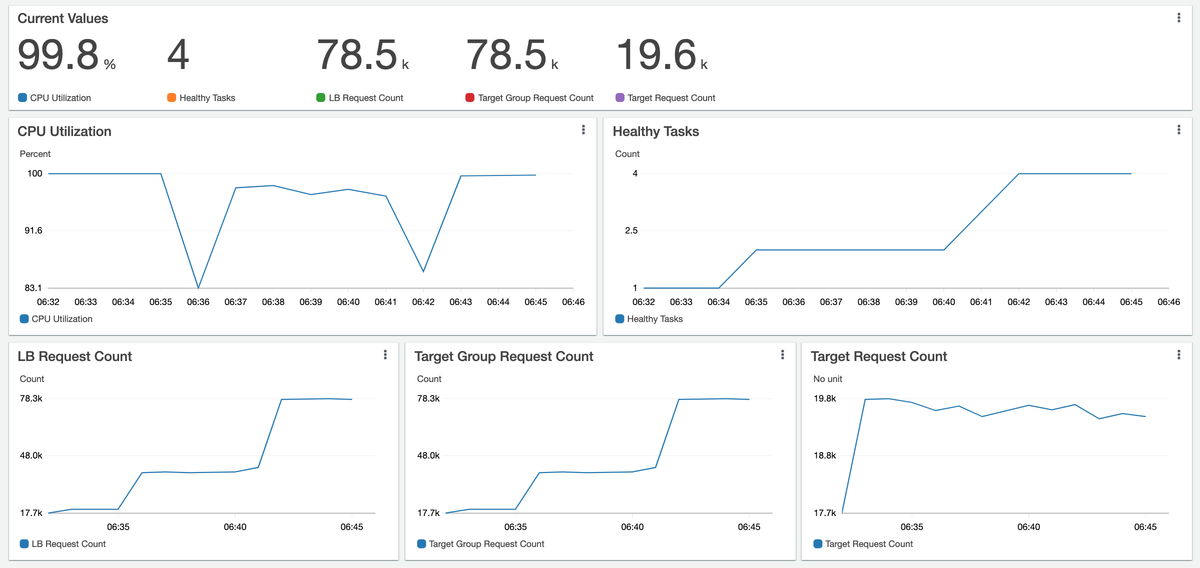
Here is our service dashboard as scale-out events happen:

In this dashboard we observe the expected behavior that after a few minutes of service CPU utilization being above the target of 50%, the number of tasks start increasing. With each task registered as a target within the target group, we see that the single target request rate remains at about 20K requests per minute, but the target group request count (as well as the load-balancer request count) grows fairly linearly with the added task count. That is, with 4 tasks in service, we reach almost 80K requests per minute.
Another way to verify the behavior is by using the AWS CLI to query ECS API for service events:
$ aws --output json ecs describe-services --services <service name> --cluster <cluster name> | jq .services[0].events
This should return a JSON array of events listing when tasks have been started and registered as targets with the target group associated with the service.
Request Count Scaling
We could also scale by request count as shown in the scale-by-request-count branch of the project. To do that, we need to specify the target group of the service as well as the request rate per minute of each target:
 scalableTaskCount.scaleOnRequestCount('RequestCountScaling', {
      targetGroup: albService.targetGroup,
      requestsPerTarget: 10000
    });
We've already seen that a single task (or target) can handle around 20K requests a minute, so the scaling rule above would only affect the scaling behavior, but would not limit the number of requests per target. As we still have a maximum of 4 tasks running, the load on each task would remain at around 20K unless the maximum capacity value is increased. You could easily verify that by redeploying the stack and rerunning the load test.
For this target tracking policy the Application Auto Scaling Service creates two corresponding alarms based on the RequestCountPerTarget metric of the service-associated load balancer and target group. A similar approach is taken here as we've seen with CPU Utilization scaling. Namely, one alarm is triggered when the 10,000 requests per target threshold is breached after 3 minutes and should cause a scale-out event. Another alarm is set for when the metric value is below a threshold value of 9,000 requests for a period of 15 minutes. As we've seen before, this is to avoid flactuations in capacity as well as scaling in too quickly.
Scheduled Scaling Example
Before wrapping up let's have a look at the example on the scheduled-scaling branch of our project:
scalableTaskCount.scaleOnSchedule('ScheduledScalingScaleOut', {
    schedule: Schedule.cron({ hour: "9", minute: "0" }),
    minCapacity: 4,
    maxCapacity: 8
});

scalableTaskCount.scaleOnSchedule('ScheduledScalingScaleIn', {
    schedule: Schedule.cron({ hour: "12", minute: "0" }),
    minCapacity: 2,
    maxCapacity: 4
});
In this example we add two scheduled actions to fit an increase in load on this service every day between the hours 9 and 12 UTC. The first is set to run every day at 9:00 UTC and update the minimum and maximum capacity to 4 and 8, respectively. Recall that the current capacity will be compared to the new values and will be updated if it falls outside the limits. For example, if at 9:00 the current capacity is below 4 tasks, the scheduled action will add capacity to reach the new minimum. The second scheduled action uses more conservative capacity limits.
Note that updating the minimum capacity at 12:00 UTC will not lower the current capacity of 4 which has been changed by the initial increase. In this case it might be useful to combine the scheduled actions with a target tracking scaling policy.
Summary
In this article we've learned the role that the Application Auto Scaling Service plays in scaling ECS services. We've created a simple ECS service stack using the CDK and using a custom CloudWatch dashboard observed how it behaves under load. We then extended the service using different scaling methods and observed how the service scales. There's definitely more to explore, including the usage of custom metrics with target tracking policies. As always, be sure to tear down the example stack with cdk destroy when you're done testing to avoid incurring additional costs.